
Performance Review
30 Charts But How Many Farts?

Good evening. I opened this Substack on June 12, 2025, with a price analysis of STIM. Over the ensuing five weeks, I published 29 additional posts, not including this one. While none of my posts are “financial advice”, I suspect some readers placed or held trades, based in part on my analyses. Additionally, I strongly suspect that still many other readers viewed my content but were not so moved. Finally, I know that the vast majority of financially-minded Substackers have not seen any of my writing at all. In order to vindicate the first, encourage the second and invite the third, I thought it prudent to illustrate how well (or poorly) trades based on my analyses are fairing. In this case my sensibilities against ‘tooting’ the horn are outweighed by my desire to grow my paid subscriber base. And here we are.
Now, it should come as no surprise and yet must be restated: many—probably the majority—of the charted names were brought to my attention by the almost all-knowing, almost all-powerful Citrini, who I continue to recommend. Citrini has warned his subscribers against copy-trading (placing a trade he’s made, when he says he’s made the trade). He does this and yet also publishes an index of global names he’s bought, which have outperformed the S&P 500 by a considerable amount since its inception over the last two years or so. It’s quite the dance. Nevertheless, some trades have gone against the purchaser or seller very shortly after a Citrini trade announcement. In many cases, these names recover and make new highs, albeit after dramatic intervening drawdowns/ups. Sometimes Citrini’s portfolio responds. Sometimes—grounded in macroanalytical conviction—it does not. Sometimes Citrini has exited a thematic conviction on the basis of a single, underwhelming earnings release or even less.1 I started this Substack with the primary purpose of complementing this fin-genius’ frequent timing problem (he’s not a chart scribbler). I actually made a collaboration offer to his team, but offer went unacknowledged.
The chart below simply tracks the performance of an entry, positive or negative, made in accordance with an explicit trade plan, rounded to the nearest tenth of a percent. If a plan’s trigger has not yet been met, the performance is of course null. As always, time horizon is a necessary component of the correctness of a trade. A proclamation that a stock is undervalued by, say 100%, may not stop the stock from first dropping another 30%, climbing to the predicted level and then dropping another 30%. In that respect, there are two ways to be “right” about a stock—right in an absolute sense (the stock will hit a target, damned what may happen before or after it does) or right in a relative sense (the stock will hit a target within a certain time-window).
Saying the market will eventually recognize the intrinsic value of a company is not a viable trading strategy UNLESS the market does so recognize in the period of time you need it to be true. Recognition always takes the form of favorable price action within a favorable time frame. One’s thesis is MEANINGLESS unless the market agrees, through price. There is only a single caveat to price adherence—the so-called “Gap Risk”. In other words, you may come across horrible-looking charts that subsequently become un-horribled, sometimes in a single trading session. This is always a possibility and slap in the face to even the most stoic chartist. Still, in my experience, the phenomenon is a substantial minority of cases. The bulk of gap situations still (admittedly, anecdotally) appear inside price pattern tolerances or as an accelerated realization-of actual, forecasted implied moves. Ergo: it is still prudent (and profitable) to respect the chart. And, from a secular (information awareness stance), it may become increasingly prudent to devalue gap risk, as time goes on. How likely is it that the market’s propensity to be surprised by new information actually increases? Look, humanity can barely muster enough new power plants to electrify new data centers under construction. I’ll take the Under.
 - S07E20 Training Day | Video clips by quotes | 5e1a165b | 紗")
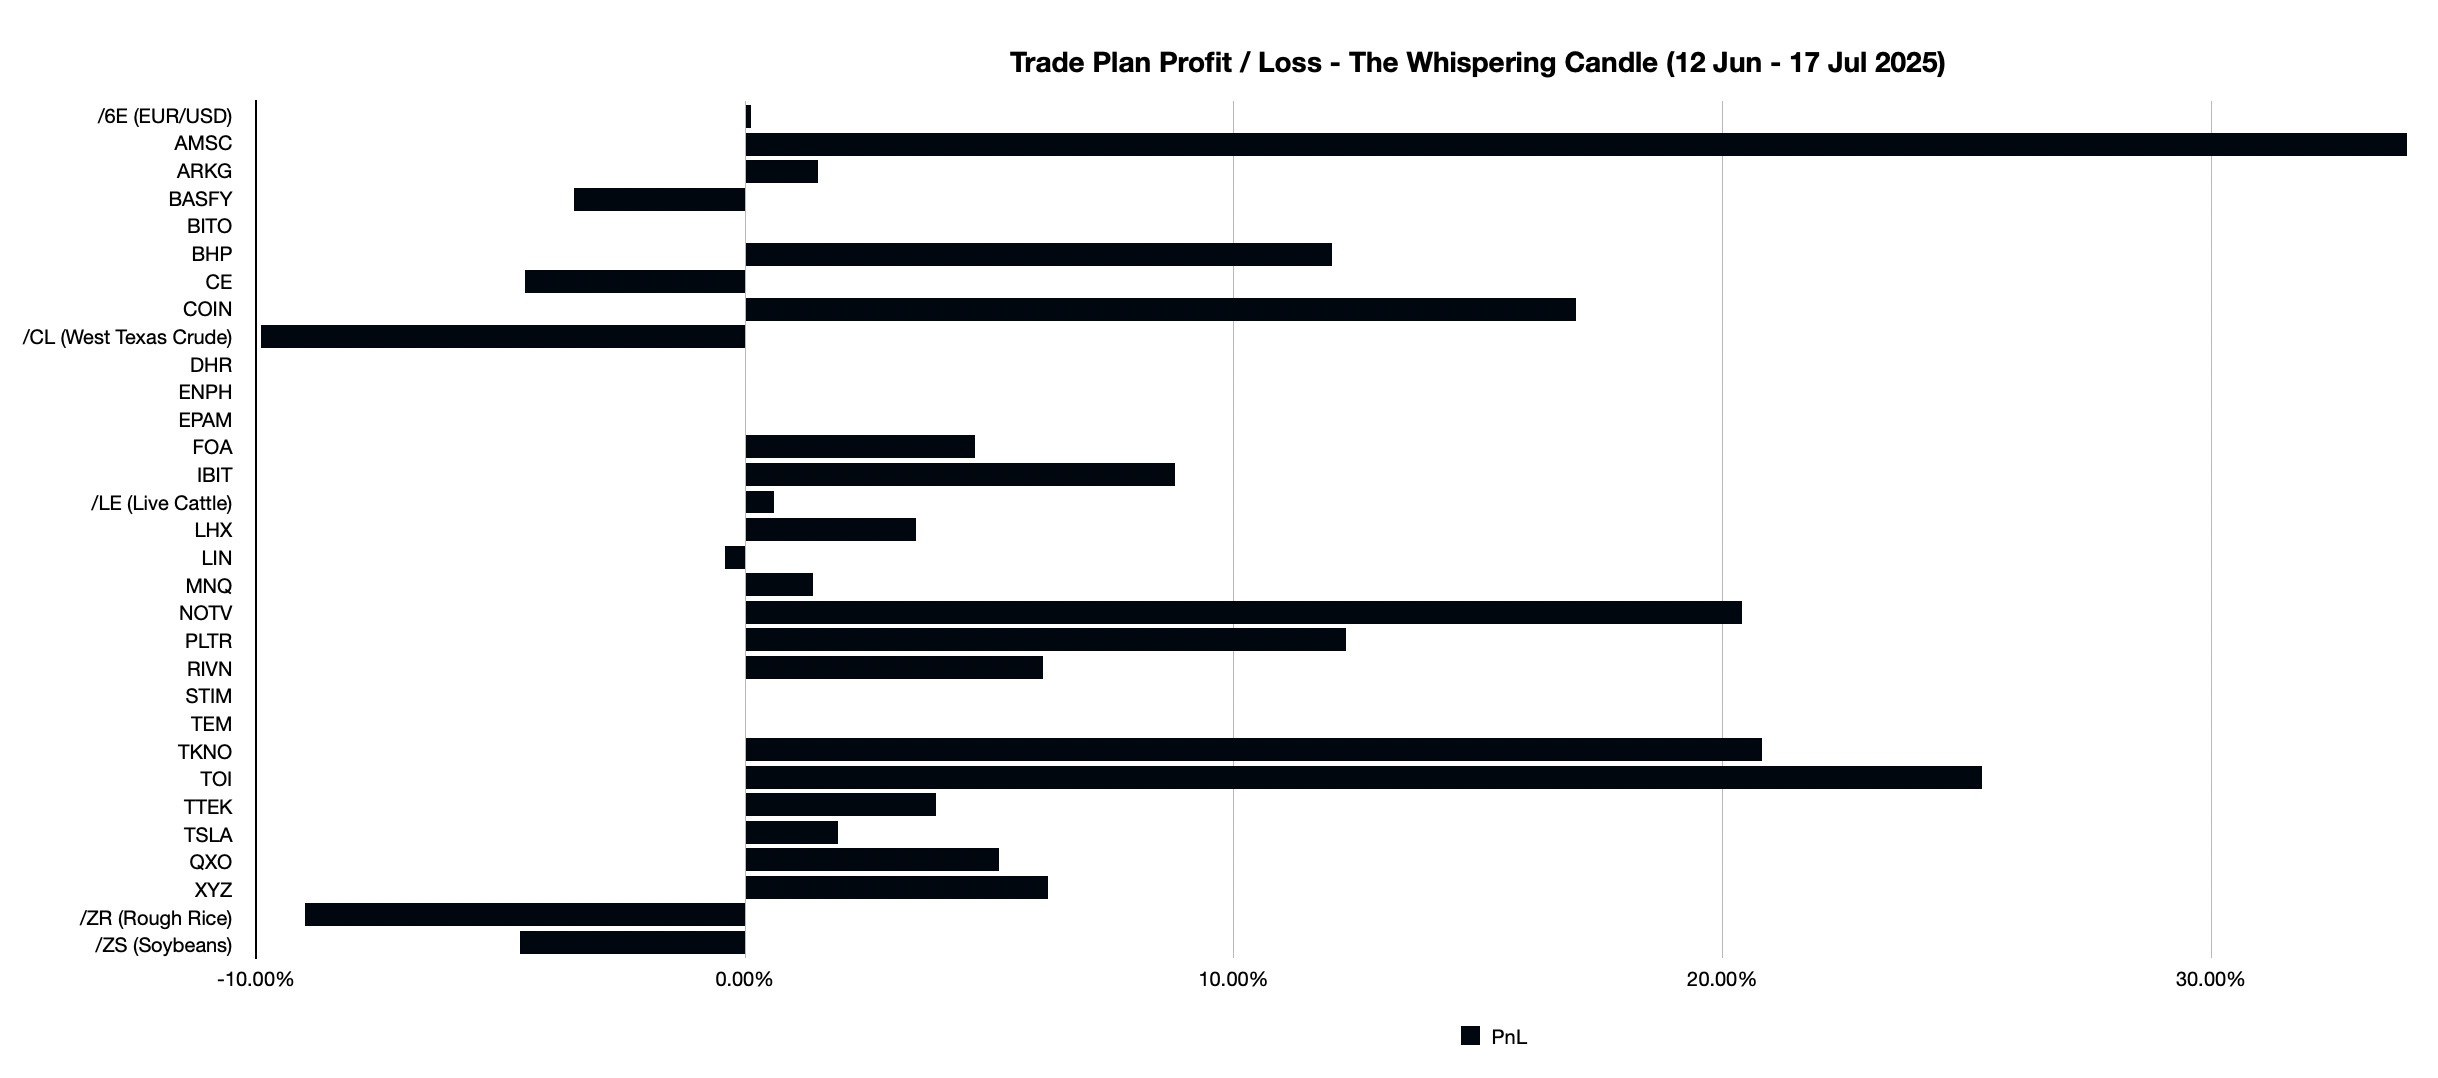
Note: Securities denoted as a “Citrini Name” were either in the Citrini portfolio or received positive mention by the Citrini team in their Substack chat, at the time I wrote about the name in a post. 0% PnL indicates that the trigger in my post has not come to pass. I do not currently necessarily own all of the securities I have written about.
I hope this Performance Review creates more interest in the price analysis approach I use. I hope investors and traders consider its value, in conjunction with the macroeconomic analyses accomplished by others on Fin-stack. Five weeks is the blink of an eye. I will leave you to further investigate the validity of my approach in the relevant posts. Subsequent reports will follow, as trading plans trigger and as securities make their full implied moves. Thank you for coming.
Trading Principle: “If you can’t measure it, you can’t improve it” - Peter Drucker (sort of) (1954)
On April 13, 2025, in a thematic note, Citrini exhorted his “overweight” position on CVRX. Less than a month later (May 9), with little explanation that I could find, he exited and put the money on TKNO. Apparently, the chart was not consulted. CVRX would go on to gain 75% while TKNO would lose 34%. At the time, of his note, I decided to buy CVRX. At the time of his exit, I assessed a possible Inverted Head & Shoulders could be possible. I decided to stick it out and also purchased some TKNO. CVRX was in an IH&S and rewarded handsomely. TKNO was not interested in reversing its downtrend, but I didn’t suffer as much as others (see my note).